

In terms of its housing market, Vilnius is often compared to the nearby city of Kaunas or the Baltic neighbours Riga and Tallinn just a short car journey away.
Meaningful as it may be, it is worth extending the scope of comparison towards some of the more distant cities which are nonetheless similar to Vilnius in many other respects, such as Krakow, Wroclaw, Poznan and Helsinki. They are all located about 700-800 km from the Lithuanian capital (or 100-150 euro by aeroplane) and can therefore be viewed as alternative locations for business.
Important aspects for benchmarking
Firstly, from experience, we can see that Vilnius is competing with the aforementioned cities for foreign investment and over attracting service centres. We often hear that Poznan and Krakow, in particular, surpass Vilnius in the segment of the service centre.
The second reason is related to demographics. All these cities have similar population counts. Perhaps Krakow falls out of context a little because its population is a little higher – around 770,000 residents – but the remaining cities have very similar populations, ranging from 550,000 to 650,000 people. Based on preliminary data from the Department of Statistics of early 2021, Vilnius city municipality had 569,518 residents.

Here we should note one of the most important demographics-related indicators – population change. In Vilnius, Helsinki and Wroclaw the change has been positive, while Poznan and Krakow are currently witnessing a downward slope.
Another metric for comparing the cities is average wages, i.e. net earnings. In this category Helsinki stands out with wages 2-3 times greater than in Vilnius. On a more positive note, Vilnius surpasses all of the remaining competitors. For example, the average salary in Vilnius is 958 euro, whereas the average pay in the Polish cities barely surpass the 800 euro threshold after tax.
The average cost per square metre of a newly built economy-class apartment building is another important indicator. In this category, Vilnius is comparable to its Polish neighbours: 1,800-2,000 euro per square metre. Helsinki, meanwhile, outperforms the other benchmarked cities with considerably higher pricing – here a single square metre is worth around 5,000 euro. This is not surprising, as due to higher wages the housing affordability evens out between the cities.

Real estate situation overview
We have also looked at another important indicator – the number of deals on the primary market, i.e. the homes that developers are selling for the first time. 2019 was a record year for housing market in Vilnius, with sale of over 6,000 apartments. In this category, Krakow and Helsinki stand out considerably with over 10,000 sales each, while Poznan falls behind Vilnius by 25% and Wroclaw surpassing it by 35%.
Another criterion that should be mentioned is how many unsold apartments developers have as of right now. Vilnius has the smallest “reserve” – 5,500 apartments, while Wroclaw has the highest number on offer – 9,600. The “reserve” ranges from 5,600 to 7,000 apartments in the remaining cities. That said, a large number of properties are yet to be built but are already on sale and available for reservation.
So how many square metres can be purchased with an average salary in each city? Here, instead of the usual mixture of good and bad news, we have two positives to report for Vilnius. Firstly, Vilnius and Poznan are leading in terms of housing affordability among the cities mentioned. Secondly, the numbers are nonetheless very similar, which shows that we have chosen suitable competing cities for our analysis. In Vilnius and Poznan, a single average wage will buy 0.49 square metres, while in other cities – from 0.47 to 0.48 square metres. The market is therefore fairly similar and balanced across the cities being compared.
Room to grow
The axiom here is simple: the more people are able to work, the better functioning of the economy. Since 2012, the demographic indicators of Vilnius (its population count) have been steadily increasing. Today we see growth of around 5%. Naturally, this translates into growth of demand for residential space.
The number of new apartment contracts per resident is currently at 0.019. We are a little behind Wroclaw, Krakow and Helsinki, but ahead of Poznan.
When predicting how long it would take to sell the available “reserve” of apartments on the market, we see that in Vilnius it would be less than a year. According to analysist, this demonstrates that the real estate market is sustainable and positive.
Meanwhile in Helsinki the timeframe for selling off the “reserve” is even shorter. The residents of the Finnish capital fear that properties in the city might become even more expensive than they are now, which leads to huge demand – as soon as a real estate project appears, apartments are immediately sold out.
If we want to catch up with Wroclaw on the number of contracts per resident, we need to sell around 7,000 apartments a year on the primary market. If we wish to catch up with Krakow, the number would be even higher – 8,000 properties.
Offices vs residential properties
In terms of the relation between the availability of offices and residential properties, we can firmly place an equal sign here. Sadly, Vilnius and Poznan are demonstrating the poorest results in this category: in Vilnius we see 1.3 square metres of office space per resident, with 1.1 square metres in Poznan, while Helsinki is leading with 6.7 square metres per resident. If Vilnius were to catch up with Wroclaw’s 1.8 square metres per resident, we would have to build another seventeen skyscrapers similar to those located on Constitution Avenue (Lit. Konstitucijos prospektas) equalling some 260,000 square metres of office space. Catching up with Helsinki would mean building more than 200 such buildings!

Vilnius is a growing city with a growing population, growing economy and living standards so there is also scope for increasing the availability of office space. It is a well-known truth that more offices mean better-paid jobs and a more attractive city for young people. All these conditions create opportunities for the demand curve of the housing market to move upwards.
Impact of COVID-19 pandemic on housing market
Several key factors should be mentioned here: the newly available “money taps” from local and European governments, maturity of the state and its businesses as well as the fact that the country is not dependent on businesses such as tourism which have been worst affected by the pandemic.
Governments are injecting vast sums of money in order to revitalise their economies, while businesses are starting to think not only of themselves. Many of them are now demonstrating solidarity, donating supplies such as medical equipment and so on. Meanwhile banks are allowing “loan holidays.” If we were to add the afore-mentioned steadily growing demography of Vilnius, we predict that the housing market in Vilnius will continue to grow.
Throughout the pandemic we have not recorded a decrease in new property prices. Quite the contrary – some growth has actually been observed, which shows that even the second wave of COVID-19 is not indicating towards a decrease in house prices in Vilnius.
Numbers and facts
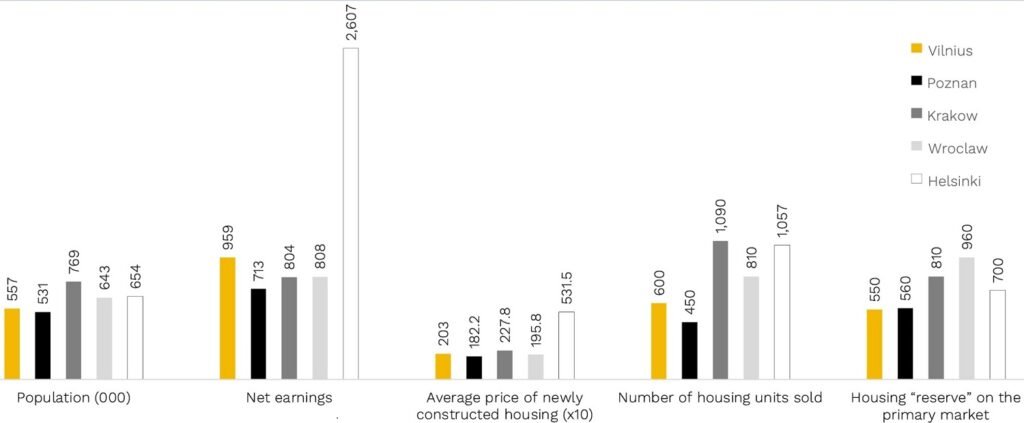
- Population in 2020: Vilnius – 557,440; Poznan – 531,030; Krakow – 768,731; Wroclaw – 643,290; Helsinki (city territory) – around 654,000 (Citus data);
- Average net wage in 2020: Vilnius – 958.66 euro; Poznan – 713.48 euro; Krakow – 803.54 euro; Wroclaw – 807.74 euro; Helsinki – around 2,607 euro (Citus data);
- Average price of newly constructed housing in 2020: Vilnius – around 2,030 euro per square metre; Poznan – around 1,822 euro per square metre; Krakow – around 2,278 euro per square metre; Wroclaw – around 1,958 euro per square metre; Helsinki – around 5,315 euro per square metre (Citus data);
- Number of sales on the primary housing market in 2019: Vilnius – 6,058 units; Poznan – around 6,400 units; Krakow – around 10,900 units; Wroclaw – around 8,100 units; Helsinki – 10,571 units (Citus data);
- Housing “reserve” on the primary market, Q2 2020: Vilnius – around 5,500 units; Poznan – around 5,600 units; Krakow – around 8,100 units; Wroclaw – around 9,600 units; Helsinki – around 7,000 units (Citus data);
- Population of Vilnius city: 2012 – 533,279, 2013 – 537,152; 2014 – 539,707; 2015 – 542,626; 2016 – 543,493; 2017 – 545,280; 2018 – 547,484; 2019 – 552,131; 2020 – 557,440 (Data from the Lithuanian Department of Statistics);
- Housing affordability (statistical residential space affordable for one average wage) in 2019: Vilnius – 0.49 square metres; Poznan – 0.49 square metres; Krakow – 0.46 square metres; Wroclaw – 0.47 square metres; Helsinki – 0.48 square metres (Citus data);
- Statistical office space per city resident in 2019: Vilnius – 1.4 square metres, Poznan – 1.1 square metres; Krakow – 1.8 square metres; Wroclaw – 1.7 square metres; Helsinki – 6.7 square metres (Citus data).
Be the first to comment