

However, it seems that buyers were refraining from a decision to buy, considering the opinions of the public domain. What did they “win”? A bit higher price again. Opinions work, so they must be disseminated responsibly.
One of the key “narratives” this year is the housing market indicators that hit the pre-crisis levels: prices, sales volumes (and sales value). Very similar indicators were seen in 2007, when the RE market bubble formed. The question is whether a new NT bubble will be formed again. However, can the comparison of these two periods be correct for the assessment of those indicators separately from other figures? Definitely not, so let’s take a deeper insight.
What is the difference in the Vilnius housing market between 2007 and 2018?
Some experts believe that now is the time worth waiting and not buying housing. They believe prices should soon fall for several reasons: a sharp increase in supply (the so-called “stock”), a potential RE bubble and global economic trends.
Significant stock influence has not yet occurred. On the one hand, a large part of it consists of the projects of strong and stable developers that are less time-sensitive and can wait for their buyers; there is a greater separation between the budget, medium and prestigious property classes which necessitates more diversity in supply, which, in turn, generates the general stock. On the other hand, there is no consensus on what should we consider an offer and what a stock: housing planned, built, sold, etc., – which gives rise to uncertainty and the possibilities for different interpretation of data. Of course, the expectations of developers are very positive and, in a long run, excessive supply could distort the situation, but it is still obviously healthy.
Therefore, I will not elaborate at this point. Interest rates are rising slowly and there are signs that they will continue to grow. But one should note that the money so far has been almost “for free”, and other indicators still counterbalance this growth, therefore, interest rates will not yet have a significant impact on the housing market in the near future.
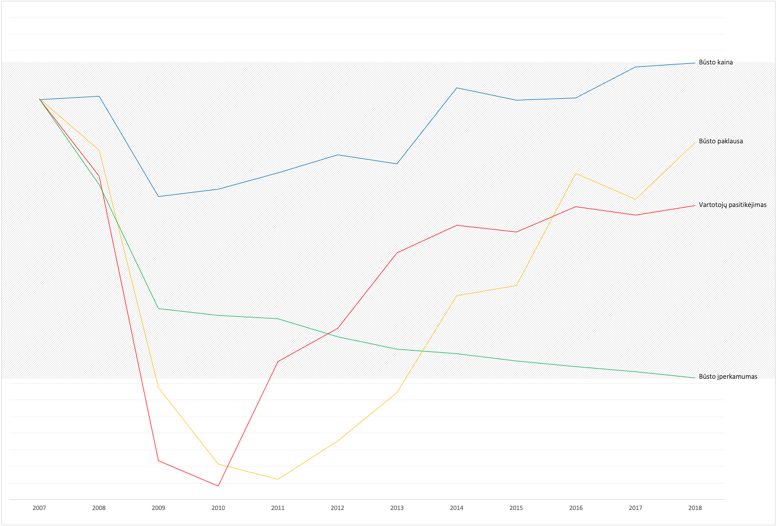
The possible threat of the RE bubble remains. This is where the market indicators of 2007 and 2018 are compared. Yes, the average price per square meter of housing in Vilnius has reached the pre-crisis levels, and demand has almost reached that level. But are the conditions and circumstances the same? Far from that.
Housing prices. What affects housing prices and what we could expect this year
Of course, as the economic textbooks say, prices are driven by a balance between demand and supply. The supply is currently growing and I do not see any strong assumptions for it to drop so far. This is determined by the growth of the population in Vilnius and the rising wages. But much has been said about it.
However, supply is not the only reason for price growth. The cost of construction (material, wages), technical requirements (energy efficiency classes), rapid growth of middle and prestigious housing share in the market are also contributing. Finally, most professionals admit that the real estate market in Lithuania is mature. Not only by its own internal mechanisms, but also by the customer’s literacy, demand, etc.
It is the customers who have, over the years, significantly raised the level of standard for housing, its environment, comfort of life, and are still raising it. As housing changes become more frequent, there is a need for a wide supply of different projects for smaller target groups. This raises competition, costs, and prices.
The same causes will also lead to the price developments of this year: prices will not vary much, but 3-5% growth can be anticipated in 2019.
Demographic situation, living standards and housing affordability
Let’s see how the situation was evolving. I am using the official statistics from the Statistics Lithuania, the Centre of Registers, the Bank of Lithuania and the European Commission. For the sake of better comparison, I mostly used the county of Vilnius, not only the city of Vilnius, but in the city of Vilnius some of the statistics looks even better.
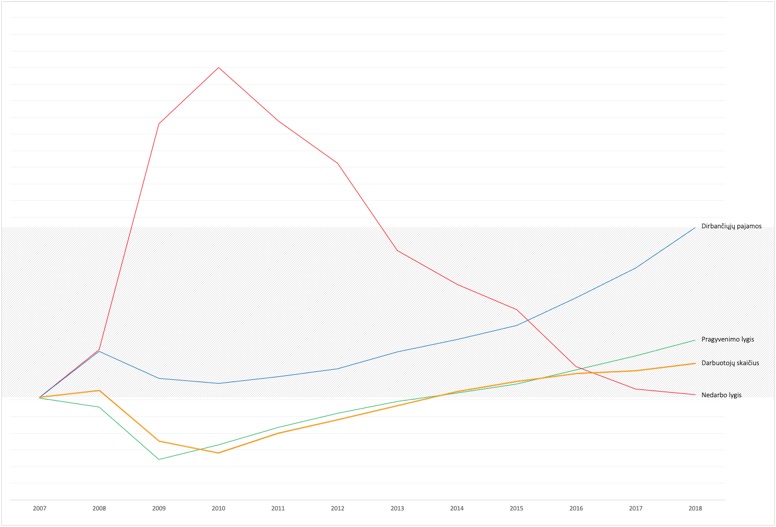
In short, the number of residents and employed population in Vilnius was growing. The employment rate has also increased and unemployment has declined. This indicates that not only the total growth of population, but also the growth of those employed and receiving table income. With investment, new, well-paid jobs – these people need housing. Their income also increased, the economic situation improved and housing affordability improved significantly. Therefore, it becomes easier for them to buy housing.
Thus, the number of people, their economic situation and the country’s indicators had already surpassed the level of 2007, housing prices only reached this level last year, and the sales are still catching up.
  |
Market maturity and regulation
The RE market has seen tremendous changes over 12 years: as I mentioned, there is a significant change in customer attitudes, expectations and requirements, the core of strong and reliable, long-working RE developers has formed, and market regulations have changed significantly. This had a critical impact on market maturity. This is emphasized by both the Bank of Lithuania and economists.
This important factor distinguishes today’s situation from the pre-crisis situation not less than the improvement of the economic situation. Then, the RE bubble was basically caused by three things: almost unregulated loan market, euphoric consumer expectations, day-lasting developers chasing big profits, and speculators (fewer, and less influential today), distorting the demand and creating preconditions for sudden price jumps. In this background (as well as having high expectations and easy borrowing conditions), buyers have been buying new homes indiscriminately.
A very noticeable change took place after the Bank of Lithuania tightened its regulation of the loan market. The main safeguards limiting the risks borne by the borrowers and which were not in existence a decade ago are the minimum contribution (15%), the requirements for the minimum maturity of the loans (up to 30 years), the maximum ratio of repayment costs and receipts (40% on the moment of the loan and a 50% theoretical increase in benefits to 5%).
The risk of the borrowers is also reduced by the fact that after the accession of Lithuania to the euro area, the country’s currency risk is no longer assessed – a considerable part of the loans were provided in litas before the crisis, therefore, banks used to add VIBIBOR interest to their margins. In times of crisis, the risk of depreciation of a small country’s currency may increase more than in the euro area, but now, due to the single currency, these additional risks are no longer relevant – Lithuanian borrowers would face the same currency depreciation risk as residents of other countries in the euro area. All of these factors mean that both the likelihood of a housing price bubble is much lower, and the potential consequences of a crisis are possibly much milder than a decade ago.
Another thing: there are fundamentally different incentives of developers to enter the RE market. Now, these activities are being undertaken by more companies with free available funds that can be invested. Many developers on the market have a great deal of experience, while buyers become more demanding, therefore, the prices, in term of quality aspects, cost, and technical requirements are adequate. However, when choosing a home today, a factor of credibility of the developer is still critical and customers should consider it.
The housing bubble has no preconditions for boosting up also because the consumer confidence index (economic expectations) today is not as euphoric as in 2007.
Summary
In the light of the above facts, it becomes clear why demand has risen, why prices have risen. However, it is also no less obvious that there were quite different conditions for these indicators to grow 12 years ago. The market is much healthier, and people buy housing because of other incentives – not encouraged by low-cost loans or easy borrowing.
The Bank of Lithuania also played an important role in tightening up regulation and increasing the resilience of financial markets. Therefore, there is not much room for a new bubble in the real estate market. Almost all economists and experts agree unanimously.
Meanwhile, the economic situation in the world is changing every day. There are different signs, but the main trend is clear: Lithuanian economy is much better prepared for surprises. Should you buy housing now? Yes, if you need it. Meanwhile, you must consider your financial capacity, sustainability of your income, regardless of the positive mood or instability prevailing in the economy.
Numbers and facts:
| Number of employees – 1 | Unemployment rate – 2 | Employee income – 3 | Living standard – 4 | Consumer confidence – 5 | Housing price – 6 | Housing demand – 7 | Affordability of housing – 8 | |
| 2007 | 486,3 | 4,5 | 633,9 | 8 327,6 | 11,7 | 1 577 | 4 529,0 | 95,7 |
| 2008 | 493,7 | 6,2 | 743,4 | 8 106,6 | 2,6 | 1 591 | 4 014,0 | 75,4 |
| 2009 | 434,1 | 14,2 | 678,6 | 6 871,3 | -31,0 | 1 196 | 1 636,0 | 46,1 |
| 2010 | 419,9 | 16,2 | 666,9 | 7 226,2 | -34,0 | 1 226 | 866,0 | 44,6 |
| 2011 | 443,2 | 14,3 | 682,9 | 7 636,0 | -19,3 | 1 289 | 714,0 | 43,8 |
| 2012 | 459,3 | 12,8 | 701,4 | 7 961,5 | -15,4 | 1 361 | 1 098,0 | 39,5 |
| 2013 | 476,0 | 9,7 | 741,1 | 8 242,6 | -6,5 | 1 324 | 1 585,0 | 36,5 |
| 2014 | 492,8 | 8,5 | 771,1 | 8 444,4 | -3,2 | 1 625 | 2 553,0 | 35,5 |
| 2015 | 504,8 | 7,6 | 804,0 | 8 656,2 | -4,0 | 1 575 | 2 656,0 | 33,8 |
| 2016 | 513,7 | 5,6 | 869,6 | 8 984,9 | -1,0 | 1 585 | 3 780,0 | 32,4 |
| 2017 | 517,1 | 4,8 | 940,4 | 9 329,7 | -2,0 | 1 707 | 3 519,0 | 31,2 |
| 2018 | 525,8 | 4,6 | 1035,5 | 9 692,4 | -0,9 | 1 722 | 4 089,0 | 29,8 |
1 Number of employees. Date of the third quarter of each year, Vilnius county Data of Statistics Lithuania;
2 Unemployment rate, %, 15 year and older population, Vilnius county Data of Statistics Lithuania;
3 Monthly gross earnings, EUR, country’s economy excluding private undertakings. Date of the third quarter of each year, Vilnius county Data of Statistics Lithuania;
4 GDP, at comparable prices (chain-linking method), million EUR. 4th quarter of each year, the overall indicator for Lithuania. Data of Statistics Lithuania;
5 Consumer confidence index. Total indicator for Lithuania as a whole. European Commission data;
6 Average cost per square meter of housing in a new building in Vilnius, Eur. Data of the Centre of Registers;
7 Number of housing transactions in new buildings in Vilnius. Data of the Centre of Registers;
8 Housing affordability index. The calculation is based on an average home loan payment by annuity divided by average net monthly salary. The resulting value shows what portion of the monthly income should be spent on mortgage loan payments. The lower the portion of income allocated for the loan repayment, the more affordable the housing is. Data of the Bank of Lithuania.
Be the first to comment